
Risk management in a manufacturing company - A real case study
- Shiju John

- Aug 11, 2019
- 3 min read
Updated: Sep 10, 2019
I have been going through different articles and forums to have a better understanding on the IT risk management, and how it is done in real time. During the process, I have come across a case study by a Hungarian organization, Szigma Szerviz Ltd, which is the first Hungarian company engaged in Integrated risk management.
The main intend of applying risk management in the manufacturing sector is to determine how the organization can attain the highest level of income by managing the different risks that occur during maintenance phase.
The Szigma IntegRisk® method, developed by Hungarian Risk Management Company SzigmaSzervíz Ltd, uses Microsoft Project® 2013 and @RISK (risk analysis add-in for Microsoft Excel and Project) for the analysis.
The solution for the case is as explained below:
1. The project managers had prepare a schedule for maintenance work with the help of Microsoft Project. The length of the simplified project schedule’s critical path was calculated. In this example, the original duration before risk assessment is 26 days as shown below:

2. The next step was to assign potential risk sources/risk events for each project activity in a series of workshops. A risk database compiled on the basis of several years of experience was used (included in Szigma IntegRisk® method). A sample is shown in the below table.

3. In this phase, scenario analysis was performed, to describe a series of impacts and the probability of their occurence for each identified risk event. (An impact refers to a risk event that can affect the original duration of a project activity). Scenario analysis is a useful tool to describe the perception of different experts and produces more reliable input data for Monte-Carlo simulation, if historical data are not available.
Selection of the critical risks was based on the previously defined threshold values. If the calculated mean value and/or standard deviation overrun the threshold, that risk is labelled as critical risk.
Following that, risk treatment actions were created for all critical risks. see Table 1.
4. The next step was to run Monte Carlo simulation using @RISK. The input for this phase is obtained from the scenario analysis phase, in the case where historical data is absent. During the simulation, lognormal distributions have been included by using mean value and standard deviation from the scenario analysis (see Table 1). SzigmaSzerviz’s experience shows that lognormal distribution is the best way to describe the nature of the revised activity duration once identified risks have occurred. This identifies the risk events that might cause huge deviation, but have a very low probability of occurrence compared to original activities’ duration. As a result, the probability distribution of the modified length of critical path was calculated. (See Figure 2.)

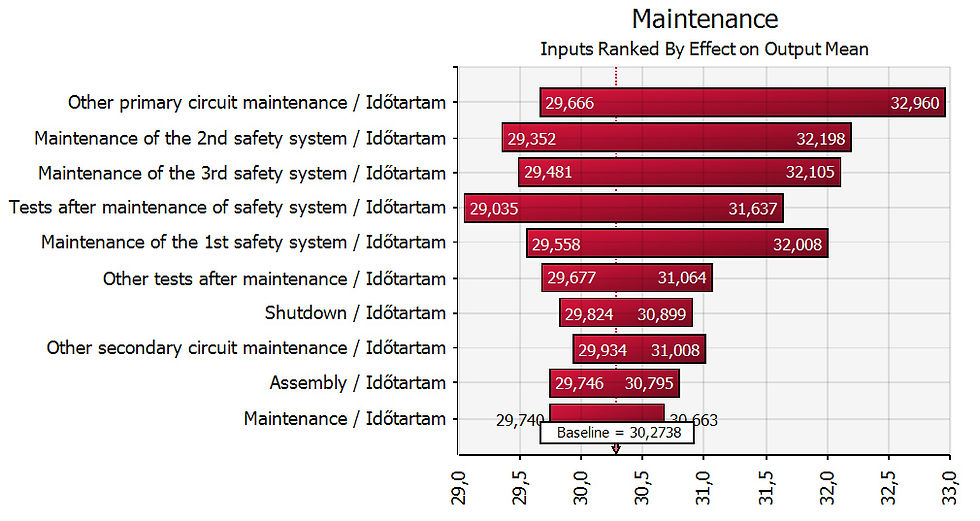
5. After finishing Monte Carlo simulation, a Tornado-diagram was generated to show the activities most likely to be responsible for delays to the project. The identified risk events assigned to most of these activities might cause the biggest deviation compared to the original length of critical path so the risk treatment actions for these activities are first carried out. (See Figure 3)
6. As a result of Monte Carlo Simulation the difference between mean and original value of the length of critical path is roughly 4 days. (26 versus 30, 258 see Figure 2). If the duration of maintenance activities is longer than planned the restart of the production is delayed which causes significant income/profit deficit for the manufacturing company. For this reason it is vital to model the impact of the results of the risk assessment on production and income/profit plan of the company, as illustrated in Figure 4.
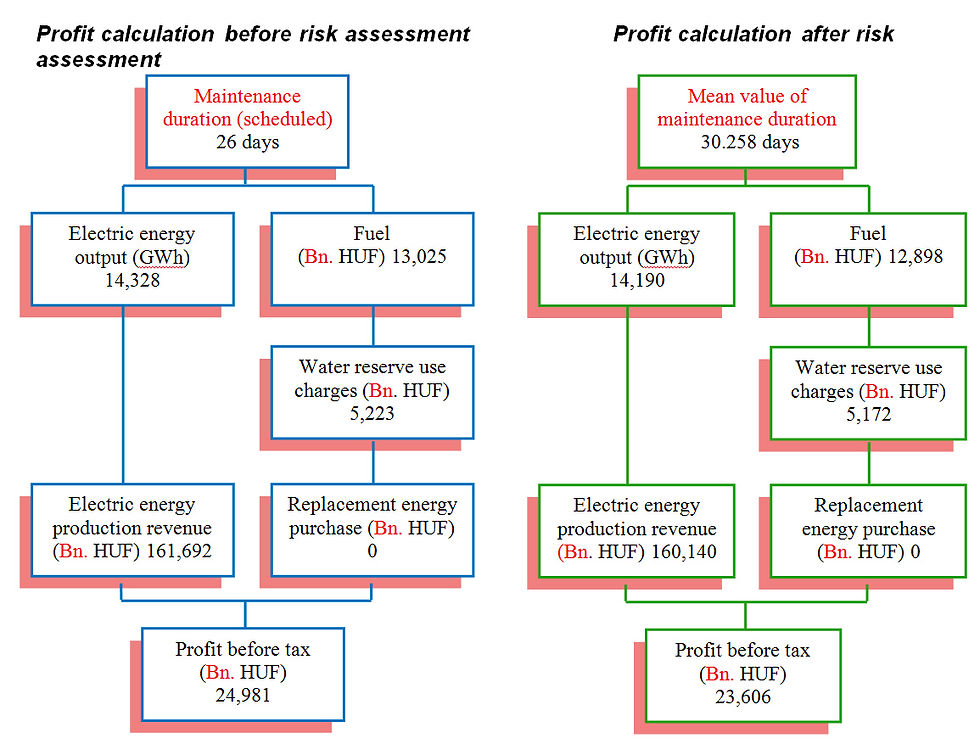
The result demonstrates that, if the maintenance work is delayed by 4 days from the scheduled date due to inadequately managed risks, the profit before tax might decrease with HUF (24,981 – 23 606) = 1.375 Bn (€ 5M). However, If the risk management activity is taken care, then the original deadline of the maintenance works could be met and thereby saving € 5M, which ended up as a loss in the current case.
According to Mr. Fekete the key benefits of @RISK are as follows:
A wide distribution gallery can be chosen for defining the probability distributions of input parameters
Good communication between Microsoft Project® and @RISK
Easy applicationUseful reporting opportunities for decision makers
Combining Szigma Integrisk® and @RISK makes it possible to produce reliable output data if no historical data is available
Reference
Palisade. (n.d.). Risk Management in a Manufacturing Company. Retrieved from https://www.palisade.com/cases/SzigmaSzerviz.asp

Comments